

Three Places to Check Usage
1. The sidebar credits meter
The Credits bar at the bottom-left of every page shows your remaining AI credits at a glance. Hover it for the details — plan credits left and your current billing period.2. Settings > Plans and usage
Settings > Plans and usage (also at the top of the Manage Subscription dialog) shows your headline numbers for the current period against plan limits:- AI plan credits (Monthly free credits on Free): credits used this period
- Emails this period (and Emails today on Free): emails sent across blasts and flows
- Contacts: contacts in People vs. your allowance
- Published tents: live tents vs. your plan’s limit
3. The Analytics area
For trends over time, click Analytics in the sidebar. It’s your workspace-wide dashboard: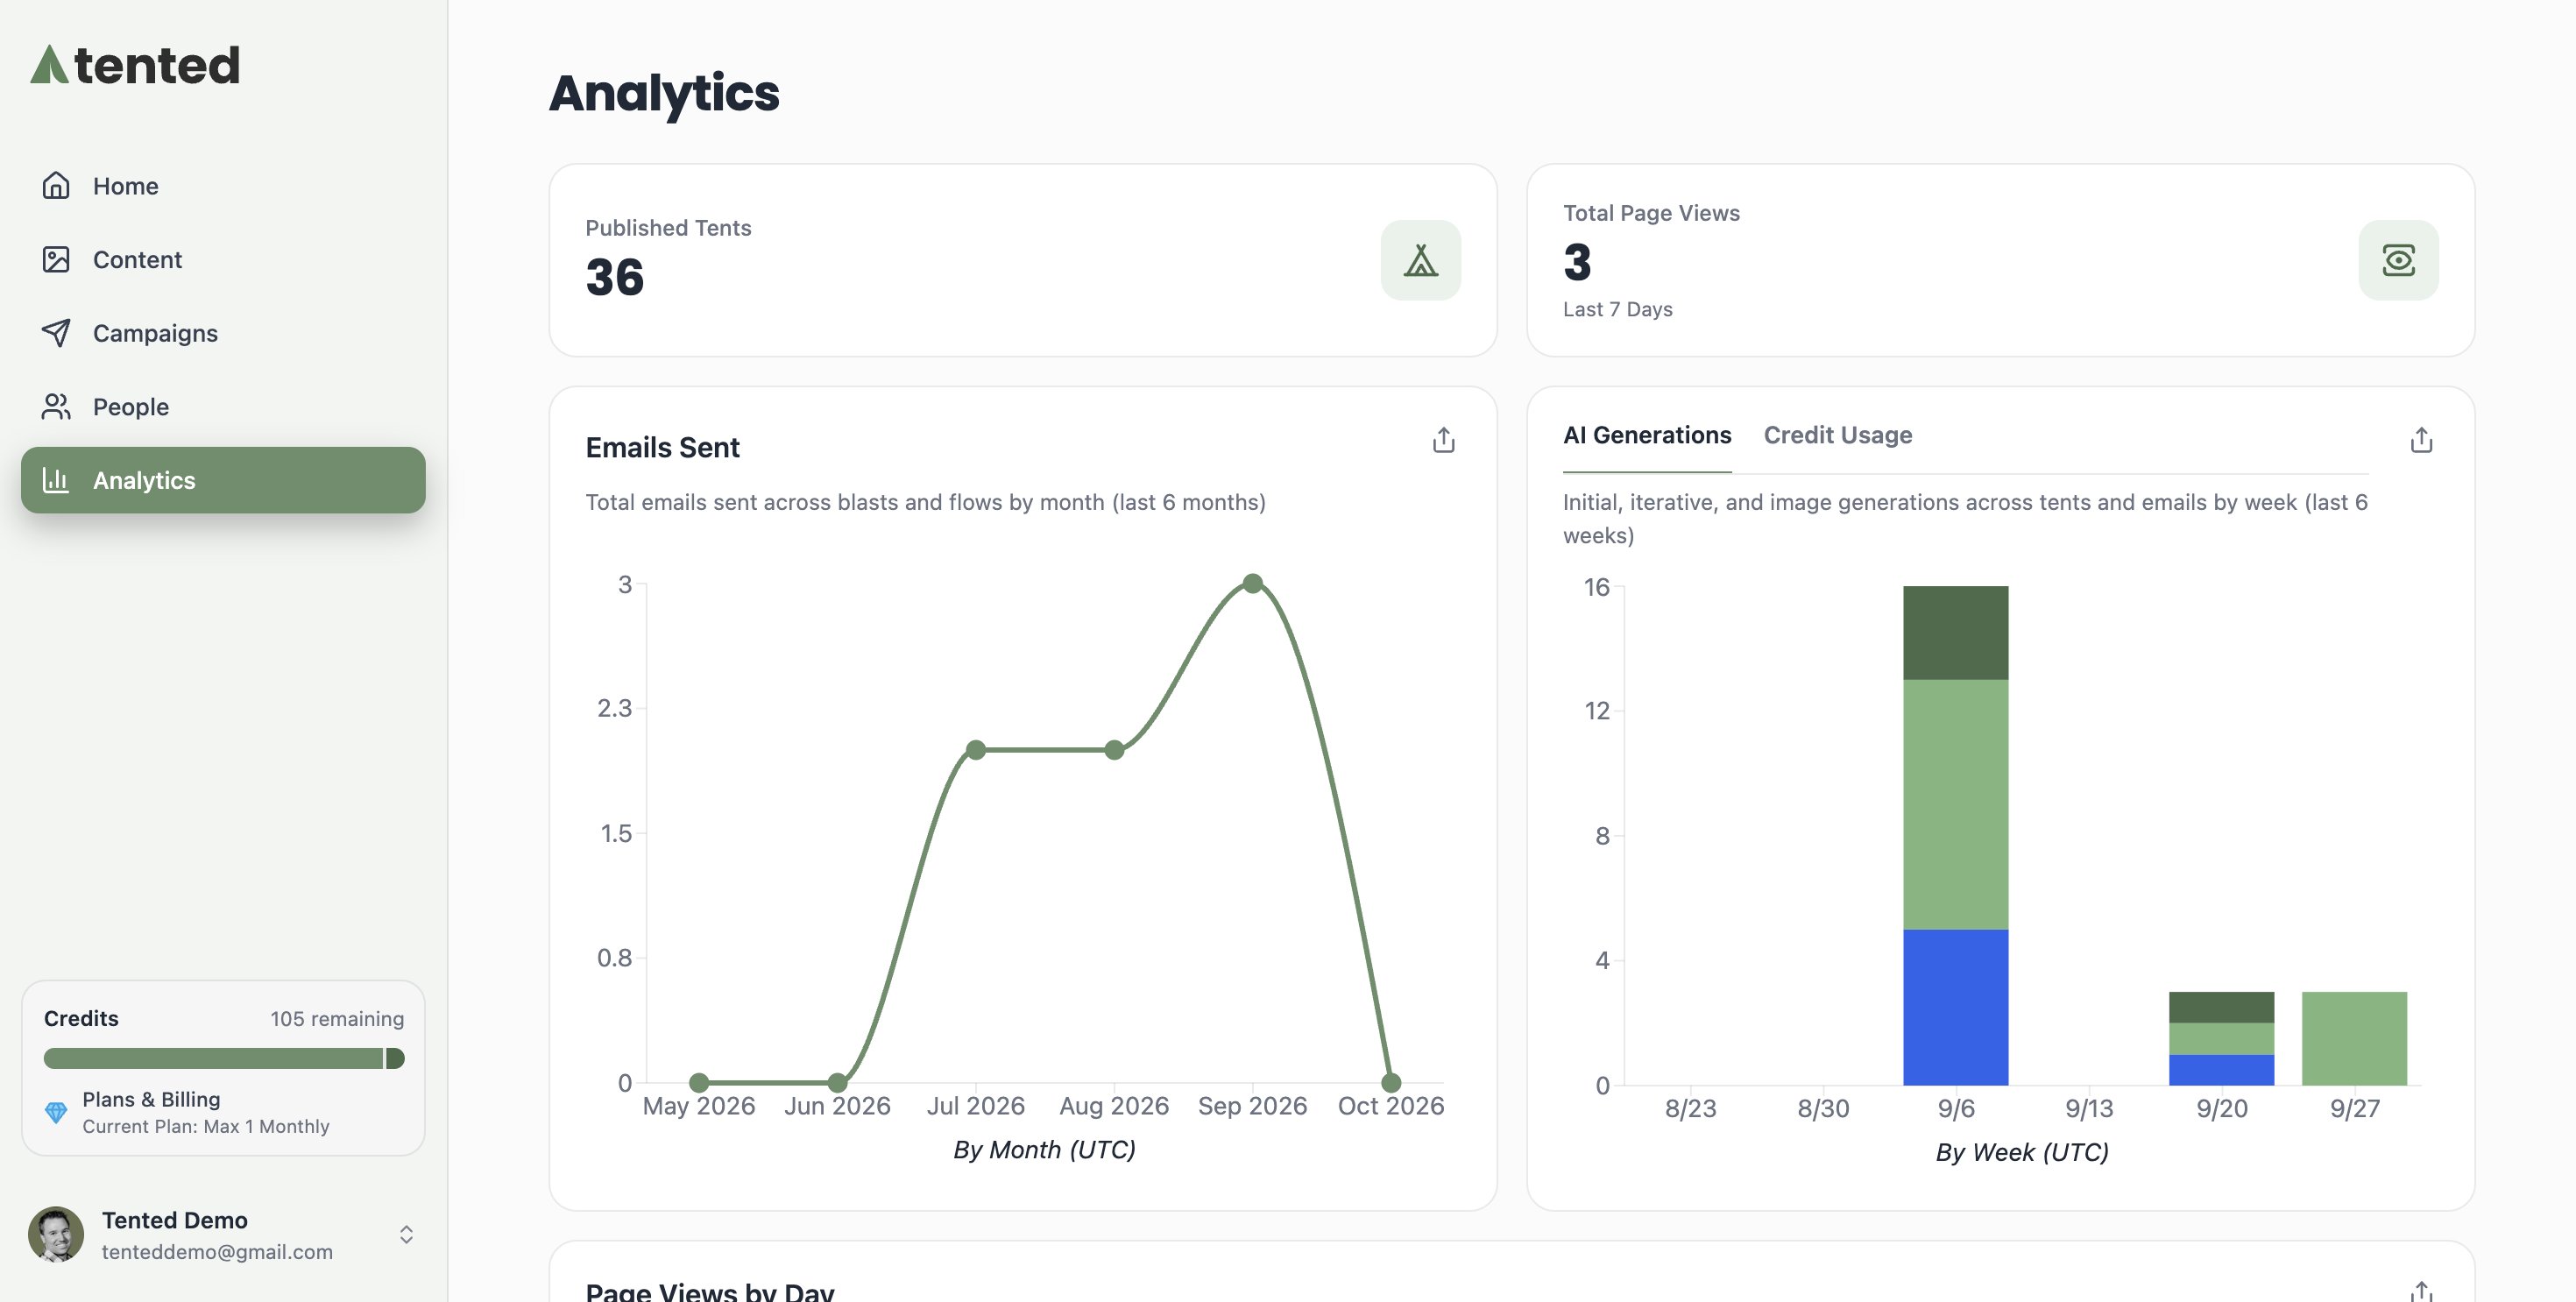
- Published Tents and Total Page Views (last 7 days)
- Emails Sent — total emails across blasts and flows by month
- AI Generations / Credit Usage — initial, iterative, and image generations across tents and emails by week, with a tab to see the same data as credits
- Page Views by Day — traffic across all your tents