The Analytics area
Click Analytics in the sidebar for a workspace-wide dashboard covering three things: how your published tents are performing, how much email you’re sending, and how you’re using AI credits.This is the workspace view. For a single tent’s numbers, use View Tent Analytics on its Tent Details page; for a specific campaign, open the blast or flow.
Traffic
At the top you’ll find Published Tents and Total Page Views (last 7 days), plus a Page Views by Day chart. Below that, traffic is broken down every way you’d want: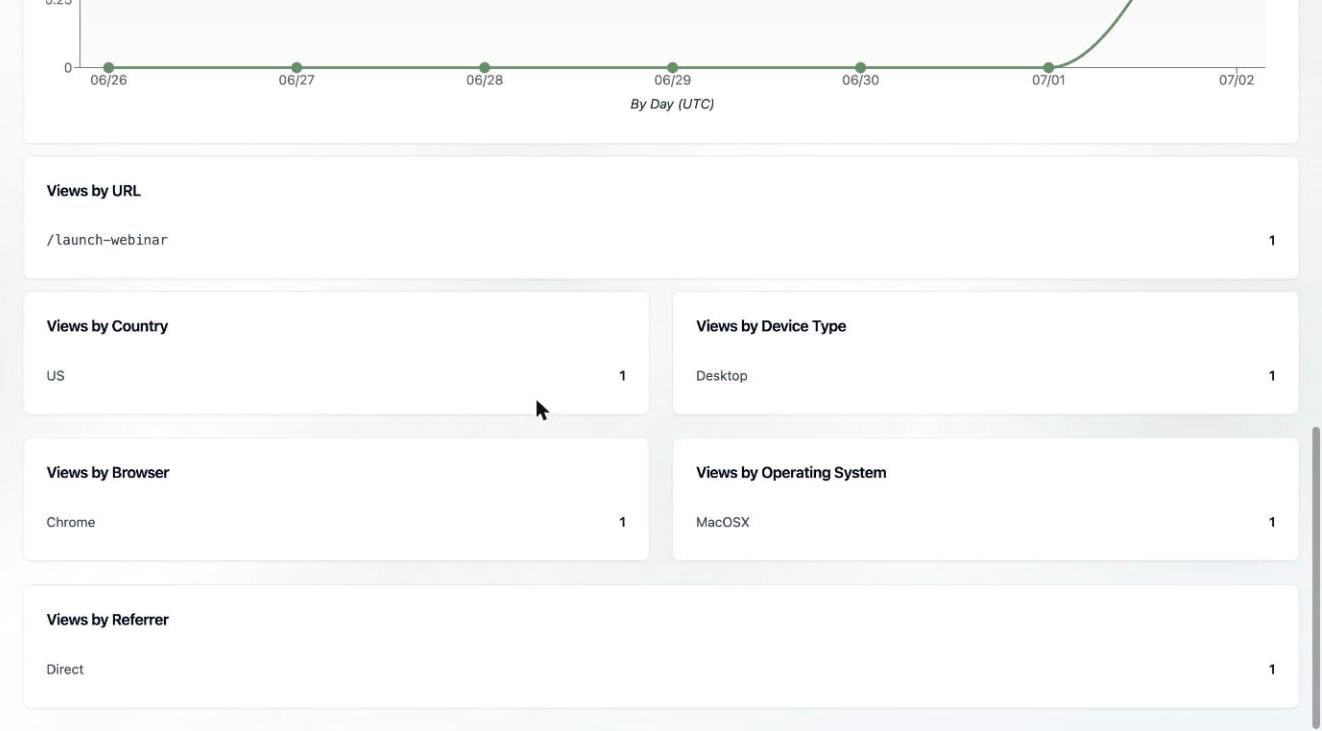
- Views by URL — which of your pages get the traffic
- Views by Country, Device Type, Browser, and Operating System — who’s visiting and on what
- Views by Referrer — where they came from (Direct, a social network, a search engine, etc.)
- Emails Sent — total emails across blasts and flows, by month, so you can see your sending volume trend.
AI usage
- AI Generations — initial, iterative, and image generations across tents and emails, by week.
- Credit Usage — the same activity expressed as credits (plan credits vs. free daily credits), by month. This is the best place to understand where your credits go.
Exporting
Every chart has a share icon in its corner — click it to download that chart as a PNG for a report or deck.Related: Viewing Current Usage
Check credits, sends, and limits against your plan.